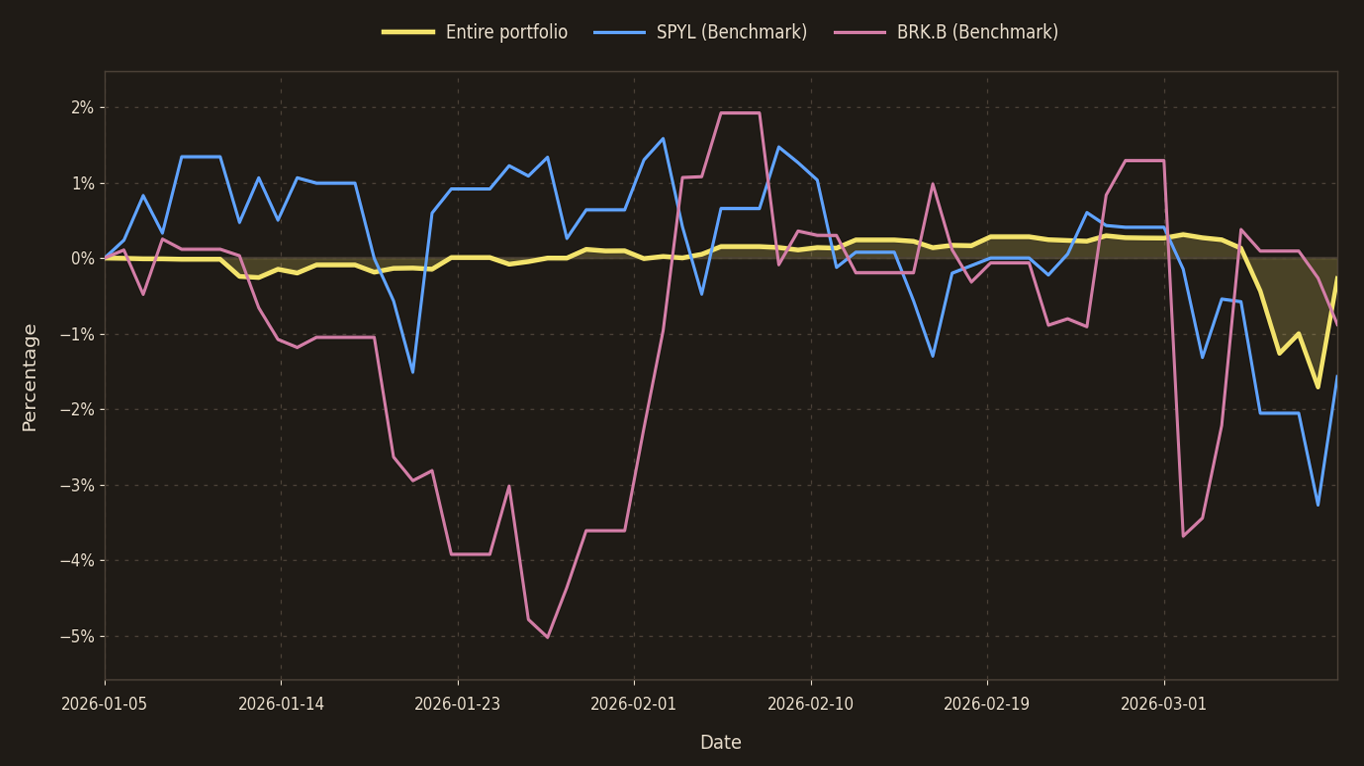
Relative Performance
Relative performance versus benchmarks since inception, calculated using time-weighted returns. Capital inflows are normalized to isolate portfolio behavior from contribution effects.
Open ChartLast update: February 1, 2026
The portfolio inception date is January 2026. The charts below document the live application of the 4M Works investment framework. Figures are shown in USD unless otherwise specified and updated only after material changes to portfolio construction or thesis, not on a fixed schedule. Early data reflects initial capital deployment and should be interpreted as a build-phase snapshot rather than a mature portfolio.
| Performance Indicators | Percentage |
|---|---|
| Return Percentage Since Inception | -0.27% |
| Annualized Return (ARORC) | -1.53% |
| Maximum Drawdown | -2.01% |
Relative performance versus benchmarks since inception, calculated using time-weighted returns. Capital inflows are normalized to isolate portfolio behavior from contribution effects.
Open Chart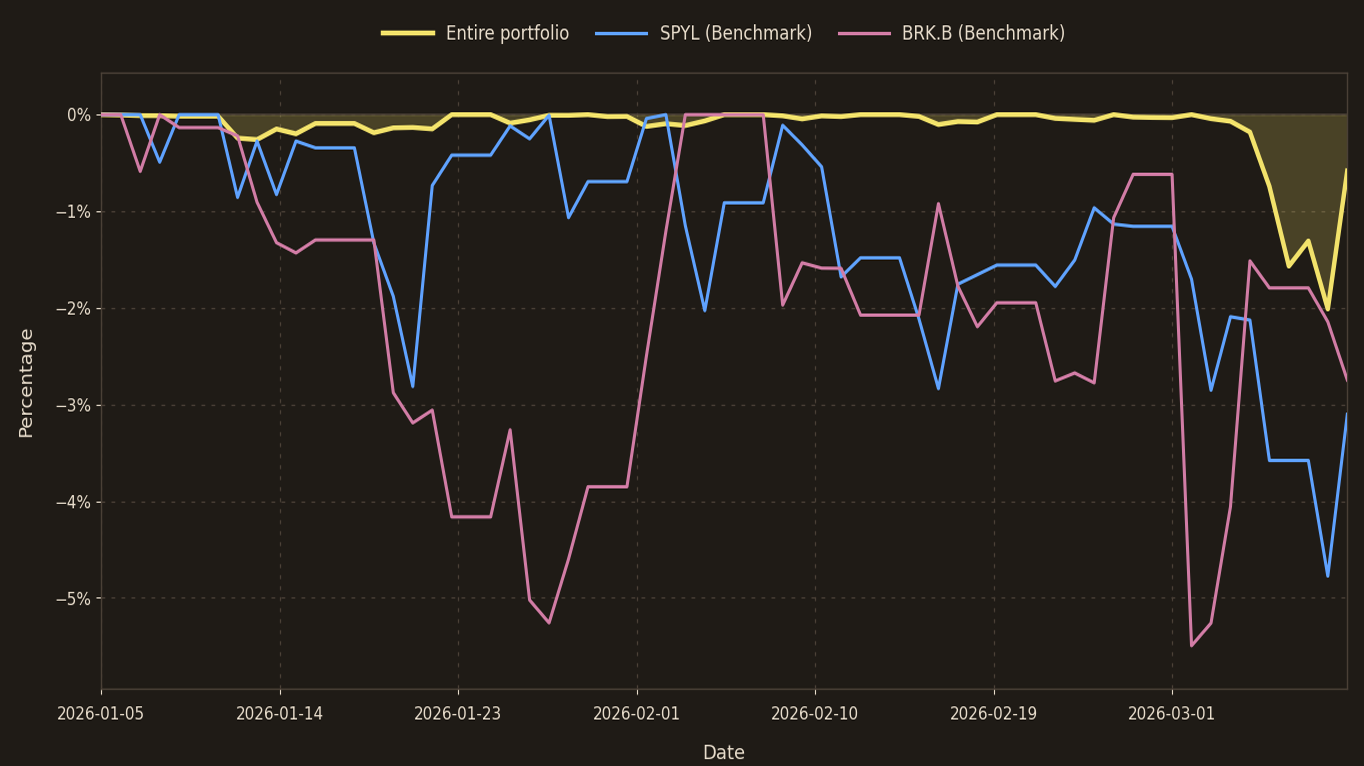
Drawdown measures declines from prior peaks over time, showing the depth and duration of adverse periods. It describes downside experienced, not long-term return potential.
Open Chart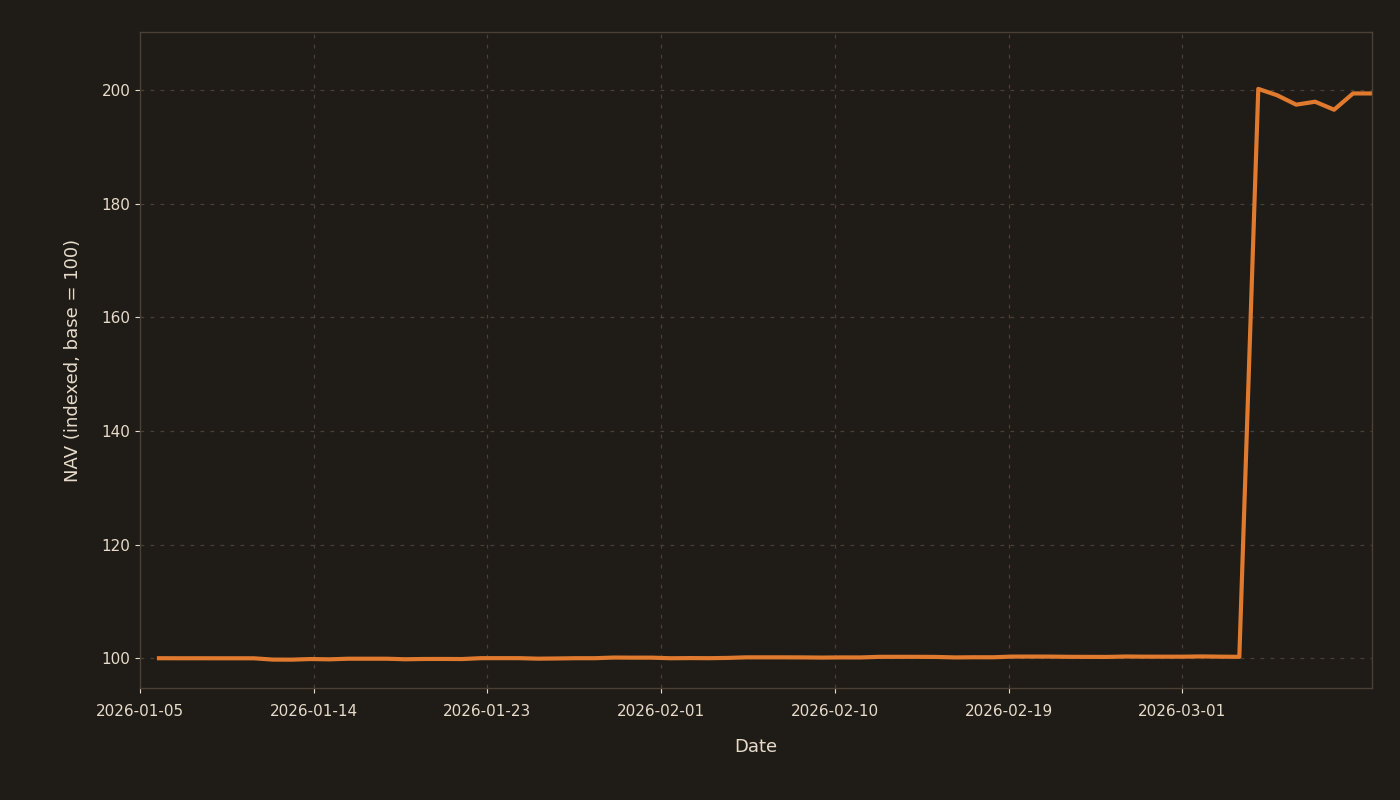
Indexed portfolio value since inception, including capital inflows and outflows. Values are normalized to 100 at the first meaningful capital deployment. The series reflects changes in total account value rather than investment performance.
Open Chart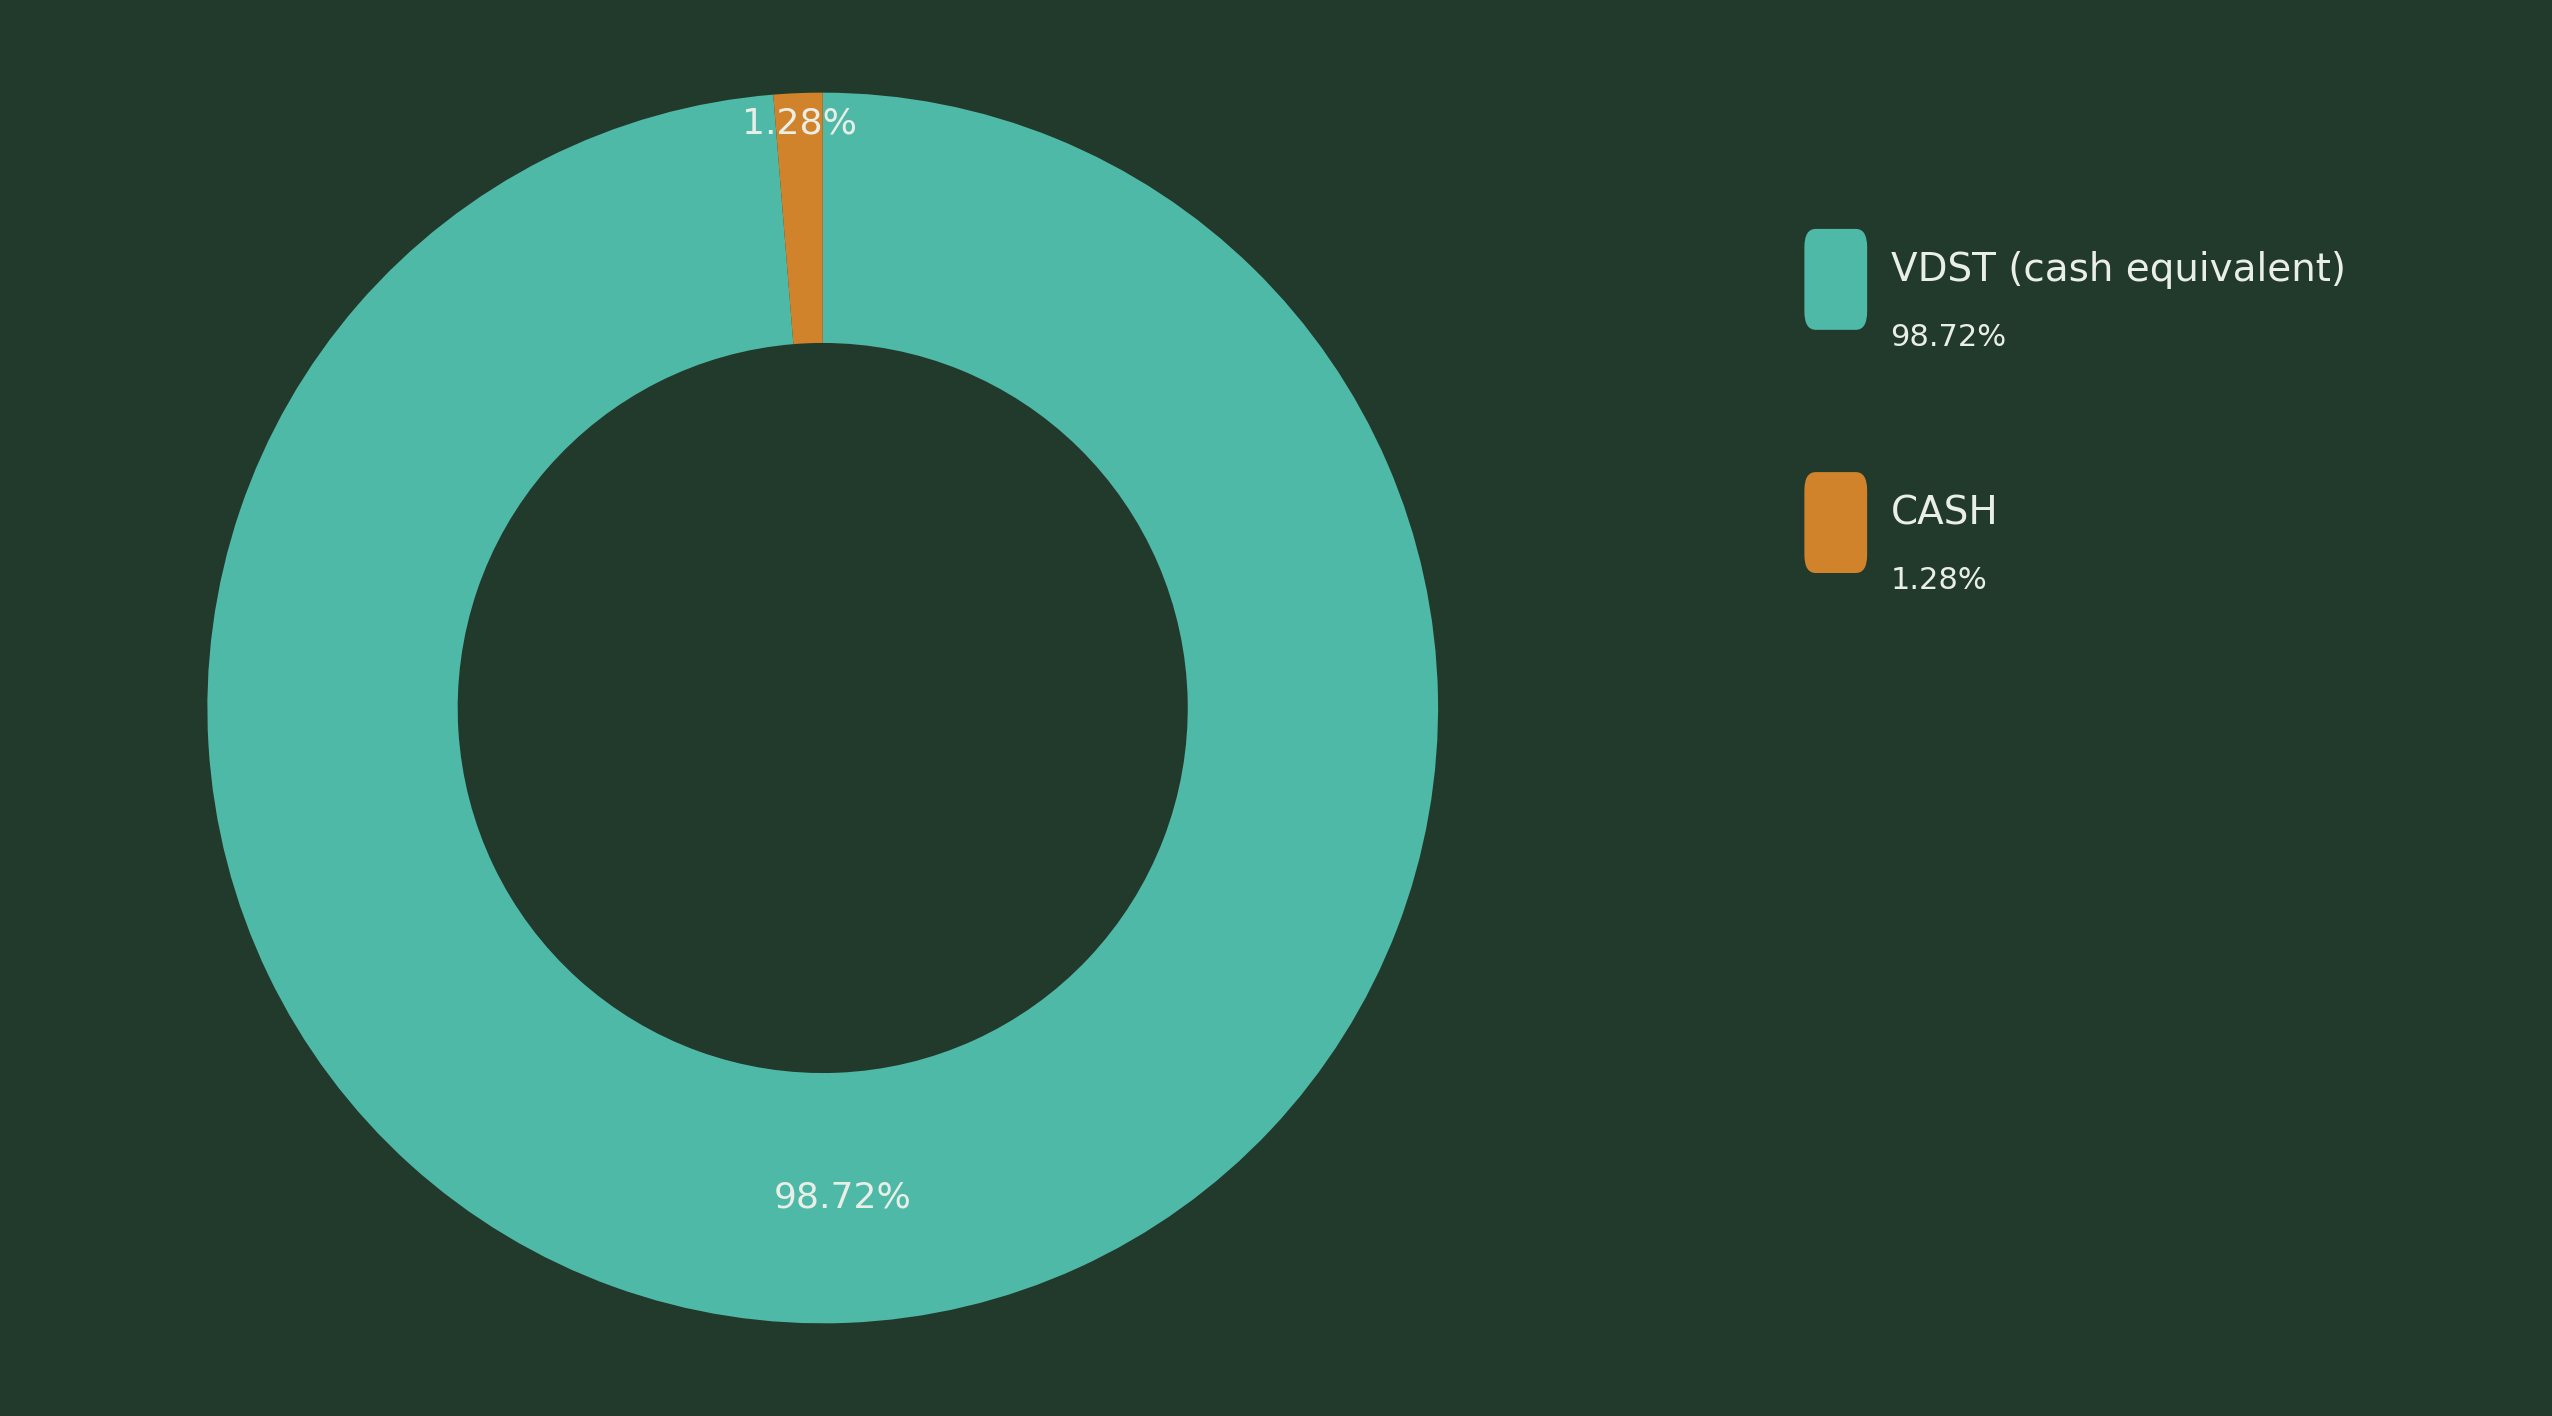
Current asset allocation by portfolio weight. Percentages reflect market value at the reporting date, with consolidated cash and cash equivalents shown separately. Allocations may be temporarily cash-heavy while positions are built and capital is deployed.
Open ChartAt the end of each quarter, a portfolio letter is published reviewing investment decisions, changes in positioning, and any material developments affecting the underlying theses. Each letter includes a snapshot of the portfolio charts at that point in time, allowing the evolution of the portfolio to be tracked alongside the written record.
Relative Performance and Drawdown are calculated on indexed return series to isolate market movement from contribution timing. Net Asset Value is an indexed account-value series that includes deposits and withdrawals, reflecting the capital deployment path rather than pure investment returns.
Benchmarks are reference points, not targets. SPYL (S&P 500 UCITS ETF, USD Accumulating) represents broad equity exposure, while BRK.B (Berkshire Hathaway Inc.) is included as a capital-allocation comparator. Differences in sector exposure, currency, and risk profile are intentional.
Performance reflects market price movements as reported by the broker. Dividend treatment, taxes, fees, FX translation, and corporate actions depend on data availability and reporting conventions. Minor discrepancies versus broker-native views may occur. FX translation is applied where relevant to express results in USD.
VDST (Vanguard U.S. Treasury 0-1 Year Bond UCITS ETF USD Accumulating) refers to a short-duration, investment-grade fixed income instrument used as a cash equivalent. It is held for liquidity management, capital staging, and optionality rather than return generation, and may temporarily represent a large share of the portfolio during periods of partial deployment.
These charts are descriptive records of decisions and outcomes over time. They are not designed to optimize presentation or short-term comparability. Portfolio construction and position sizing decisions are governed by the rules defined in the Investment Policy.